

Monitoring Dashboard
Overview
The Dashboard is the home page of the Partner's Portal. It brings together, on a single screen, the health indicators of your integrations with ME and the list of recent failures, so you can spot and investigate problems without jumping between screens.
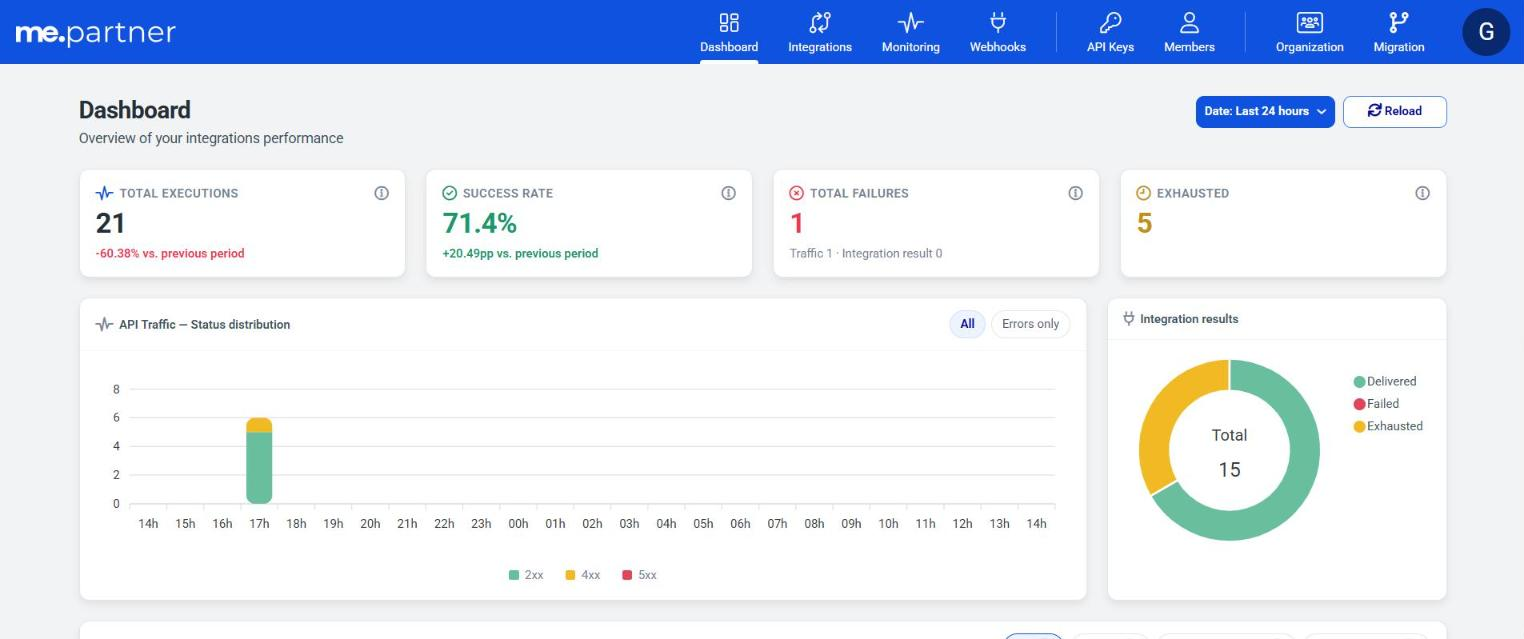
With the Dashboard you can quickly answer:
- How many calls and integrations your system ran in the period, and what the success rate was;
- Whether things got better or worse compared with the previous period;
- Which API calls failed, which integrations were rejected, and which webhook notifications never reached your endpoint;
- Where to open the full detail of each failure (the Traffic and Events screens).
ℹ️ Note
The Dashboard is a monitoring and troubleshooting tool. Its numbers are calculated from platform logs and must not be used as a transactional or reconciliation source. For that, query the APIs themselves or keep a log in your own system.
Monitored origins
Everything shown on the Dashboard comes from three activity origins:
| Origin | Shown as | What it represents | When it counts as a failure |
|---|---|---|---|
| API traffic | Traffic | Each call your system makes to ME's public APIs (for example, POST /v1/orders). | When the API answers with an HTTP status outside the 2xx range (includes 4xx and 5xx). |
| Integration result | Integration result / Int. Result | The result of the asynchronous processing of an integration — the same content as the integration.result webhook event. | When the result's statusCode indicates the document was not processed successfully. |
| Webhook delivery | Webhook / Exhausted | The delivery of the integration.result notification to the endpoint you registered in the Partner's Portal. | When every retry attempt runs out without success (Exhausted status). See the retry logic. |
❗️ Attention
A Webhook failure does not mean the operation failed in ME. It means the notification did not reach, or was not accepted by, your endpoint. The outcome of the operation itself is shown under the Integration result origin.
Period and reload
The period filter (default: Last 24 hours) and the Reload button sit at the top of the page. The selected period applies to every block of the Dashboard: indicators, charts and failure list.
| Period | Range considered |
|---|---|
| Last 24 hours | The last 24 rolling hours up to now. |
| Last 7 days | From the start of the day 7 days ago up to now. |
| Last 30 days | From the start of the day 30 days ago up to now. |
| Specific period | A date range you choose, of at most 1 year. Outside that rule, the filter shows Invalid period. |
Choose the period and click Apply to update the Dashboard.
Data is not refreshed automatically. Use Reload to fetch the indicators and the list again. The range of a preset period is calculated when you open the page or apply the filter: to bring the window up to now, apply the period again.
Indicators (KPIs)
The first row of the Dashboard shows four indicators. Each one has an information icon (ⓘ) explaining the metric.
| Indicator | What it measures |
|---|---|
| Total executions | Total executions recorded in the period, adding API traffic and integration results. |
| Success rate | Successful executions divided by total executions (API traffic + integrations) in the period, shown as a percentage with one decimal place. |
| Total failures | Executions that failed in the period, split by origin: Traffic and Integration result. |
| Exhausted | Webhook notifications that ran out of all retry attempts without success in the period. |
Comparison with the previous period
Total executions and Success rate show the change against the previous period (vs. previous period). The previous period is the window of the same length immediately before the selected period. For example, with Last 24 hours selected, the comparison is against the 24 hours before that.
- Total executions: change as a percentage (
%). - Success rate: change in percentage points (
pp). A drop from98.0%to95.5%shows as-2.5pp. - When there is no data in the previous period, the change shows as —.
Charts
API Traffic — Status distribution
Shows how many calls to ME APIs ended in 2xx, 4xx and 5xx over the period. Use it to spot error peaks and correlate them with changes on your side (deploys, batch loads, expired credentials, etc.).
- All: shows the three status ranges.
- Errors only: hides the
2xxrange to highlight4xxand5xx. This filter only changes the chart view; the indicators do not change.
The time-axis granularity is chosen automatically from the length of the period:
| Period length | Grouping |
|---|---|
| Up to 48 hours | Hourly |
| Up to 60 days | Daily |
| Up to 365 days | Weekly |
Integration results
Donut chart with the distribution of integration results in the period, in three slices: Delivered, Failed and Exhausted.
When there is no data in the period, the charts show the message No data for the selected period. If the statistics cannot be loaded, the Dashboard shows We couldn't load the statistics. Please reload.
Failures — drill-down
Below the charts is the list of failures for the period. It shows only records whose outcome is Failed or Exhausted: successful calls and integrations do not appear here.
Origin filters
| Filter | What it lists |
|---|---|
| All | Failures from every origin. |
| Traffic | API calls that returned a status outside 2xx. |
| Integration Result | Integrations that were not processed successfully. |
| Exhausted only | Webhook notifications that ran out of delivery attempts. |
Each filter shows, next to its name, the number of failures from that origin in the period. The origin filter only affects the list.
Columns
| Column | Description |
|---|---|
| Delivery Date | Date and time the activity happened. |
| Origin | Traffic, Int. Result or Webhook. |
| Integration / Key | Resource involved (for example, orders, contracts) and the activity's Correlation ID. |
| Error | Error message extracted from the API response or from the integration result. |
| Delivery Status / Attempt | Outcome (Failed or Exhausted) and, when there were retries, the attempt number, as Exhausted / {attempt}. |
| Action | Details link, which opens the activity detail panel. |
The list is paginated, with 25, 50 or 100 records per page.
Activity detail
Clicking Details opens a side panel. Its title is the integration name (or Activity detail), with the date and the Correlation ID right below. Next, a highlight sums up the outcome, for example Failed on attempt {n} or {n} retries exhausted — event will not be resent automatically. The Activity details section shows:
| Field | Description |
|---|---|
| Outcome | Failed or Exhausted. |
| Status code | HTTP status returned by the API (traffic), by the processing (integration result) or by your endpoint (webhook). |
| Attempt | Delivery attempt number (webhooks). |
| Origin | Activity origin. |
| Correlation ID | Identifier linking the activity to the original request. Use it to find the call in Traffic and when opening support tickets. |
| Event ID | Webhook event identifier (integration result and webhook). |
| Source document ID | Identifier of the log record the activity came from. |
| Error message | Full error message. |
The panel footer offers a shortcut to the matching monitoring screen:
- Open in Traffic: for Traffic failures. Opens the Traffic screen with no filter applied. Find the call by its Correlation ID and date to see the full request and response (headers, body and response time).
- Open in Events: for Integration result and Webhook. Opens the Events screen already filtered by the
Event IDand by the range from the activity's day up to today, with the event payload and the delivery attempt history. If the activity has noEvent ID, the screen opens with no filter.
How to investigate a failure
- Select the period in which the problem happened and look at the Success rate and Total failures indicators and the traffic chart to understand when the failure started and which origin was affected.
- In the Failures — drill-down list, filter by origin and open the record's Details.
- Follow the path for that origin:
| Origin | Likely cause | What to do |
|---|---|---|
Traffic with 400/422 | Payload outside the API contract (missing required field, invalid type or length). | Open it in Traffic, find the call by its Correlation ID, read the response body, fix the payload according to the API Reference and send it again. |
Traffic with 401/403 | Invalid or expired credential, or no permission for the resource. | Review the API Key and the token. See Credentials. |
Traffic with 429 | Rate limit reached. | Lower the call rate and respect the ratelimit-* headers. See Rate Limit. |
Traffic with 5xx | Instability on ME's side. | Retry with backoff. If it persists, open a ticket with the Correlation ID. |
| Integration result | The request was accepted, but the document was not processed (business rule, missing master data, etc.). | Read the Error message, fix the data at the source and send the document again. |
| Exhausted Webhook | Your endpoint did not answer 2xx within 10 seconds during all retries. | Check the endpoint's availability and the credentials registered in the Partner's Portal. See Webhooks. |
Best practices
- Send your own identifier in the
X-ME-CORRELATION-IDheader (for example, the order number in your ERP). The Integration / Key column and the Traffic and Events screens will then show a reference your team recognizes. - Answer webhooks quickly with
2xxand run your business logic asynchronously, to avoid exhausted notifications. - Watch the comparison with the previous period after every change to your system: a drop in Success rate right after a deploy usually points to the cause.
- Share the Correlation ID when opening support tickets with ME.
FAQ
Why do 4xx errors count as failures if the problem is in my payload? The Dashboard measures integration health from your system's point of view: a call that did not produce the expected result is a failure, whatever the cause. The status code and the error message help you tell errors on your side (4xx) from errors on ME's side (5xx).
Why don't I see successful calls in the list? The Failures — drill-down list is for failures only. To see every call, successful ones included, use the Traffic screen.
Does the chart's "Errors only" filter change the indicators? No. It only hides the 2xx range of the traffic chart.