

Excel Custom
In this guide, we will cover the Excel Custom functionality available in the New Comparative Map of Quotations and intended for purchasing clients.
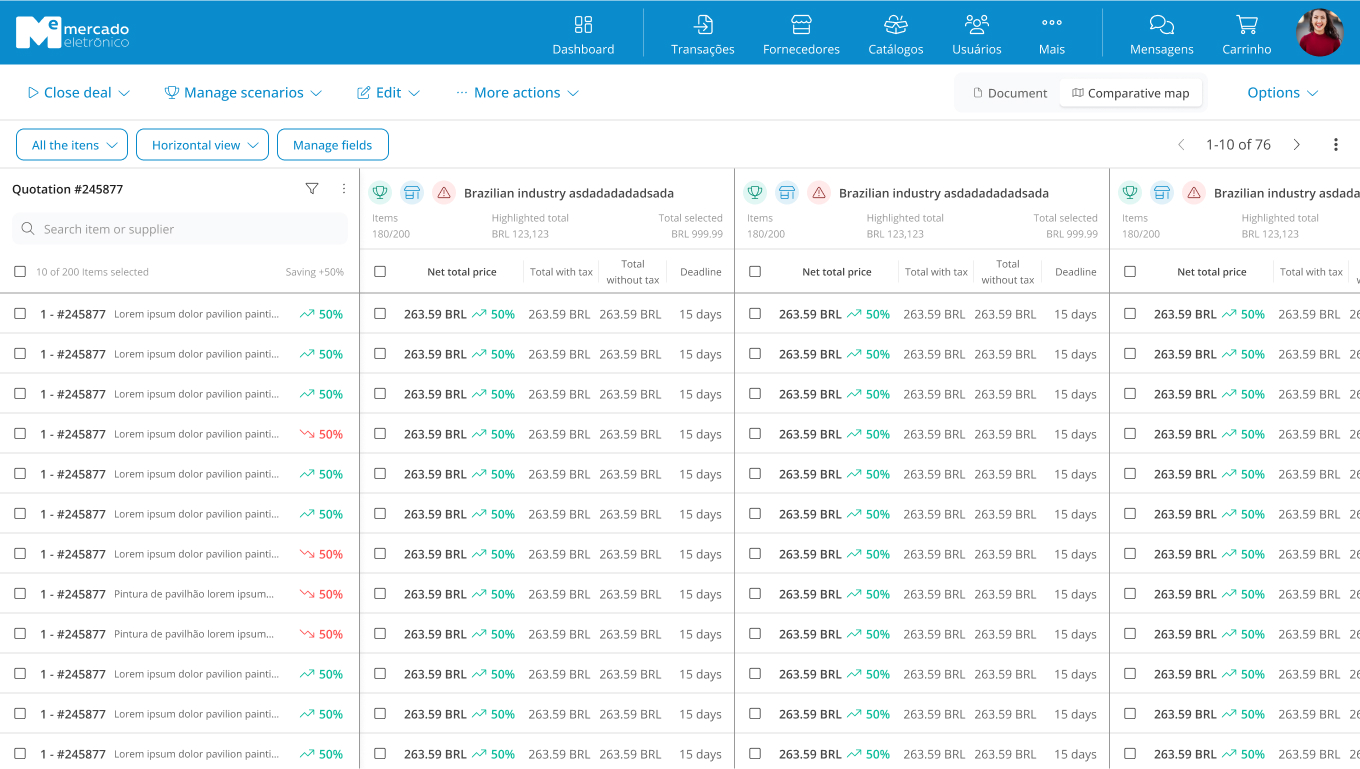
The E-proc portal from ME provides buyers with the ability to analyze prices and compare suppliers through the Comparative Map.
The information generated can be exported to Excel, offering more flexibility and autonomy for the buyer. In this spreadsheet, they can make customizations and create their own template.
Tutorial for Exporting the Comparative Map to Excel
- Access the ME portal in Transactions > Quotations > New Comparative Map and click on More Actions > Export to Excel.
- With Excel Custom, the downloaded spreadsheet of the ME standard model has 3 types of tabs which will be described below:
Categories of Tabs in the Custom Excel Spreadsheet
ME Standard Model:
- Raw Data from ME: contains the raw data from the comparative map extracted from E-Proc and organized by logical groups. These tabs display the following information:
ME_RfqHeader: quotation header data;ME_RfqItems: quotation item data;ME_RfqSuppliers: supplier data;ME_RfqAttendees: quotation participants data;ME_RfqHeaderResponses: header responses data;ME_RfqItemResponses: item responses data.
- Processed and Crossed Data from ME: the
DATA_MERGEtab contains tables with cross-referenced raw data and calculations used in the analytical tabs. - Final Reports: contains analytical views of the quotation process: details of negotiated items, supplier data, supplier proposal comparisons, savings, and much more. The tabs in this category are:
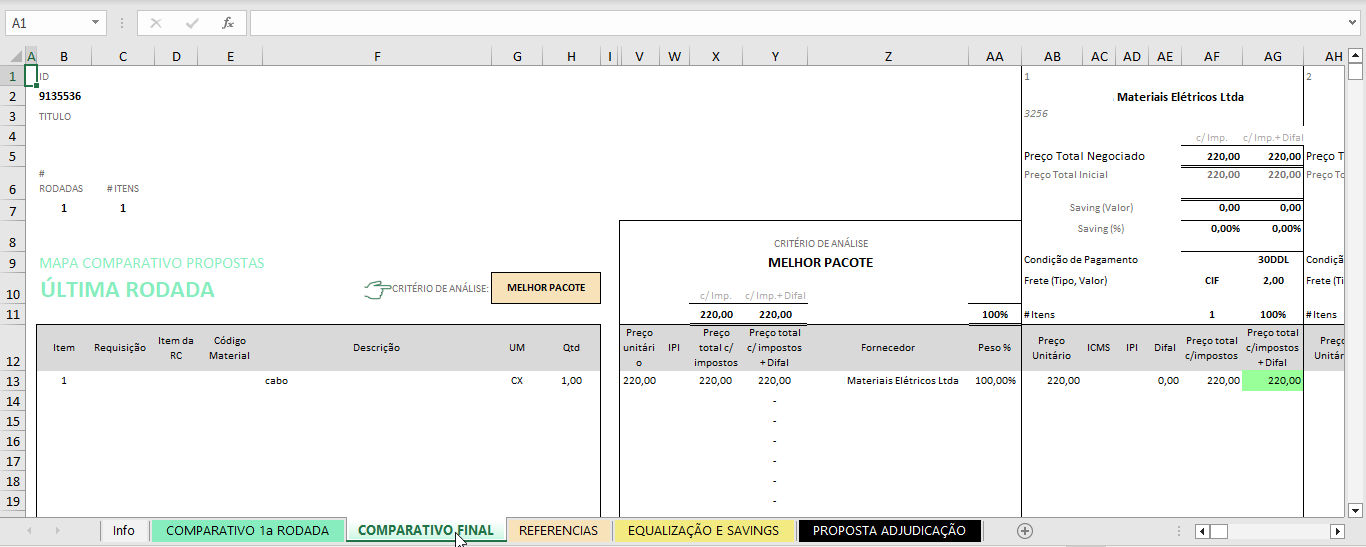
Info: an informational tab about the limitations of the spreadsheet. The ME standard model is designed for use in the following dimensions:- Maximum of 5 rounds;
- Maximum of 10 suppliers;
- Maximum of 1000 items;
- Maximum of 10000 item proposals.
COMPARATIVE 1st ROUND: shows the price comparison of the first round, where the user can switch between the best prices of items and the best package that respectively show the best supplier for each item and the supplier with the best total proposal.FINAL COMPARISON: shows the comparison of the last round. The difference from the “COMPARATIVE 1st ROUND” tab is that this tab retrieves values from the initial round, makes the comparison, and shows the savings relative to the first round.REFERENCES: this tab lists, for example, the item prices from previous purchases if available. The buyer can include more details about items, as well as factors for updating prices, such as inflation and the available unit budget for the item. Therefore, these reference data can come from the system itself or from the user to be used in savings calculations in other maps.EQUALIZATION AND SAVINGS: this map serves to equalize the proposed values with those from previous purchases if available, and calculate the savings of the best packages/best prices compared to the data provided for comparison (last purchase, budget, 1st round).AWARD PROPOSAL: this is the comparative map that summarizes the process, presents the savings, and suggests, based on the collected information, the awarding based on best prices or the best supplier proposal. Lists, for the total of items (max. 1000), the best combined proposal (best prices) and the best proposal (supplier with the best proposal).
❗️ Attention
The structure of the tabs with raw data MUST not be deleted, as it serves as the basis for building calculation and reporting tabs.
DO NOT confuse the structure with the data loaded in these types of tabs, where the data should be deleted when the buyer wants to import a custom model into ME. Learn more in the Tutorial for importing the Excel Custom template.
How to Use the Spreadsheet:
There are two alternatives for using this functionality:
- If the reference information and the provided maps already meet your needs, we recommend using the ME Standard spreadsheet;
- Otherwise, use it as a basis to build your own comparative map model. In this case, the buyer needs to maintain the structure of the ME raw data tabs (the processed data and final reports tabs are optional) and create tabs using formulas to read data directly from the other tabs.
Based on the information provided in the ME raw data tabs, buyers can also transform their custom spreadsheet into a template by uploading this file to ME.
Thus, in a future quotation, when they download the comparative map, the information can be loaded into the template model they defined as standard. Learn more in the Tutorial for importing the Excel Custom template.
Tutorial for Importing the Excel Custom Template
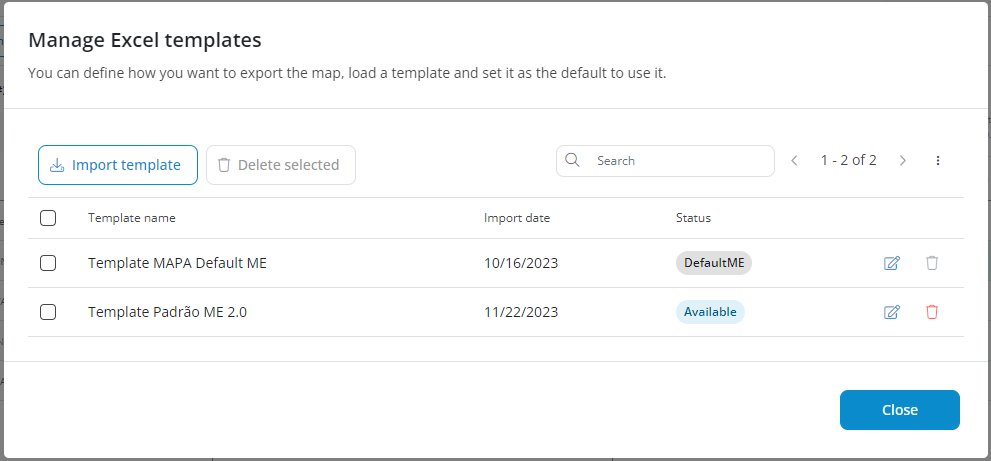
- Access the ME portal in Transactions > Quotations > New Comparative Map and click on More Actions > Manage Excel Templates.
- This screen displays the loaded templates (if any) and also allows importing, editing, or deleting models:
- Click on Import template to upload your custom spreadsheet which will be turned into a template. Remember to delete the values from the raw data tabs to avoid loading example quotation data for building your template.
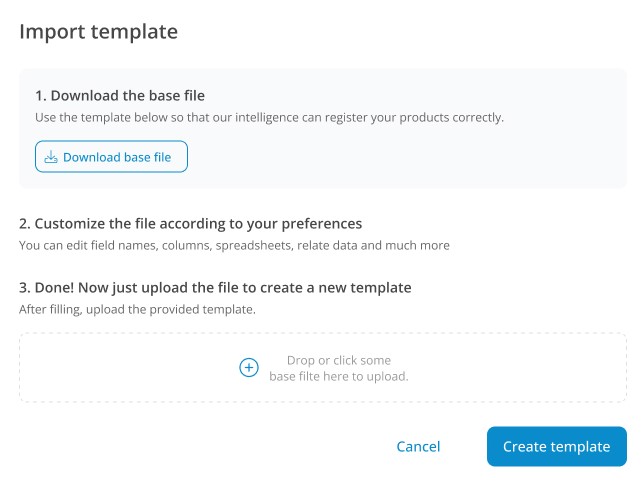
- Click on Create Template and return to the main screen.
- In the main template management screen, click Edit template to update the name or delete it:
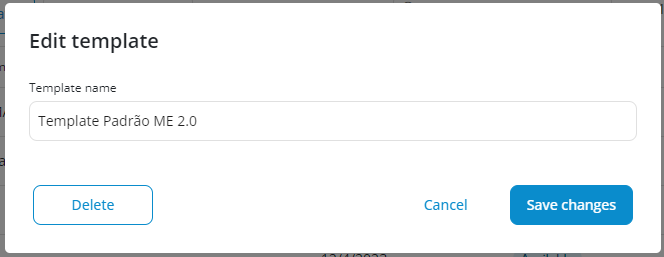
This way, future exports can be downloaded in the new template provided.
This is possible because ME will fill in the raw data for the corresponding tabs, and consequently, the associated formulas and concatenations will also be properly populated. To do this, remember to "Enable Editing" when opening the file so that Excel updates the result of the template formulas.